Precision Aging Starts with Data, Not Guesses.
The gap between chronological age and biological age is widening. We evaluate the exact biomarkers, clinical diagnostics, and at-home kits that track it.
Our Thesis
Reference ranges are designed to diagnose disease, not optimize longevity. To slow the pace of aging, we must intervene years before pathology appears on a standard metabolic panel.
Read about Optimal vs Clinical Ranges →Calculate Your Phenotypic Age
Chronological age is linear. Biological age is malleable. Use your most recent blood work to estimate your cellular age using Levine's PhenoAge model parameters.
01. Cardiovascular Optimization
The ApoB Paradigm
LDL-C is an outdated metric. The true driver of atherosclerosis is particle number, not cholesterol mass.
Read: Advanced Lipids →VO2 Max
The single highest correlator with extreme longevity. Improving cardiorespiratory fitness alters the mortality curve.
Read: VO2 Max Testing →Homocysteine
Endothelial damage driven by poor methylation. Linked heavily to cardiovascular and cognitive decline.
Read: Methylation Cycles →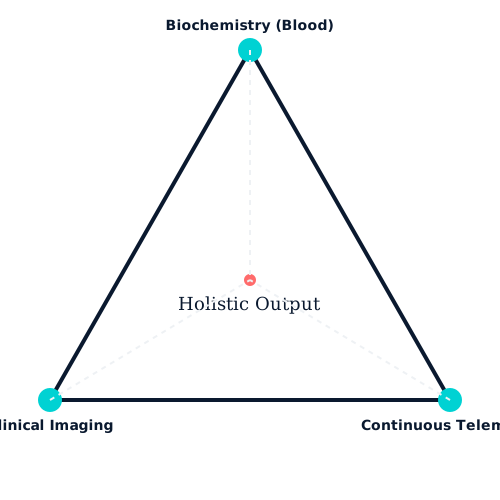
The Diagnostic Triangle
Blood work alone is insufficient. We advocate for a triangulated approach to diagnostics.
-
Biochemistry (Blood) Metabolics, Lipids, Hormones
-
Clinical Imaging DEXA Scans, Calcium Scores, MRIs
-
Continuous Telemetry CGMs, Sleep Architectures, HRVs
"You cannot optimize what you do not measure. The era of blind supplementation is over."
02. Metabolic Flexibility
HbA1c & Fasting Insulin
By the time fasting glucose rises, you have been insulin resistant for a decade. Measure the precursors.
Read: Metabolic Biomarkers →Continuous Glucose Monitoring
Real-time glycemic variability mapping. Understand exactly how specific foods impact your vascular endothelium.
Read: CGM Implementation →At-Home Kits Evaluated
View all evaluations →Epigenetic Clocks
DunedinPACE and Horvath clocks. Measuring the biological pace of aging via DNA methylation.
Evaluate →Microbiome Sequencing
Shotgun metagenomics vs 16S. Identifying butyrate producers and gut barrier integrity.
Evaluate →Salivary Hormones
Diurnal cortisol curves and free testosterone estimation from dried blood spots.
Evaluate →Genetics is not destiny.
The APOE4 allele is the strongest genetic risk factor for Alzheimer's disease. However, lifestyle interventions—specifically maintaining insulin sensitivity and high DHA levels—can dramatically alter expression.
Read the APOE4 Protocol
Stop Using BMI.
Body Mass Index cannot differentiate between metabolically active muscle and inflammatory visceral fat. Sarcopenic obesity is an epidemic hidden by "normal" BMI numbers.
Learn about DEXA ScansProtocol Design Framework
Establish Baseline
Draw blood across metabolic, cardiovascular, and hormonal domains before making any lifestyle adjustments.
Read: Interpreting Results →Targeted Intervention
Implement dietary, exercise (Zone 2/VO2 Max), or supplement protocols specific to the identified out-of-range markers.
Review: Training Protocols →Physiological Retest
Wait the physiological half-life of the marker (e.g., 90 days for HbA1c) before re-testing to verify efficacy.
Read: Protocol Design →Sleep Architecture & Glymphatic Wash
During deep (N3) sleep, the glymphatic system expands to clear beta-amyloid plaques from the brain. Wearables provide clues, but clinical polysomnography is required for definitive diagnosis of architecture failure.
Explore Sleep Diagnostics →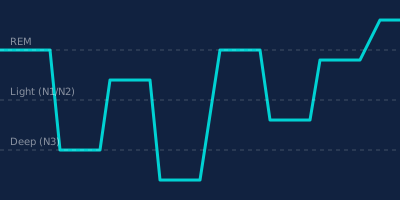
Why we don't recommend Telomere Testing
Commercial telomere testing has poor predictive power for mortality compared to third-generation epigenetic clocks. Save your money for ApoB and DEXA scans.
Read the full analysisReady to sequence your diagnostics?
Start with our comprehensive guide to building a tiered testing protocol.
Read the Protocol Guide